Visualize Operations
| Difficulty: ★ | Duration: 04:43 |
|
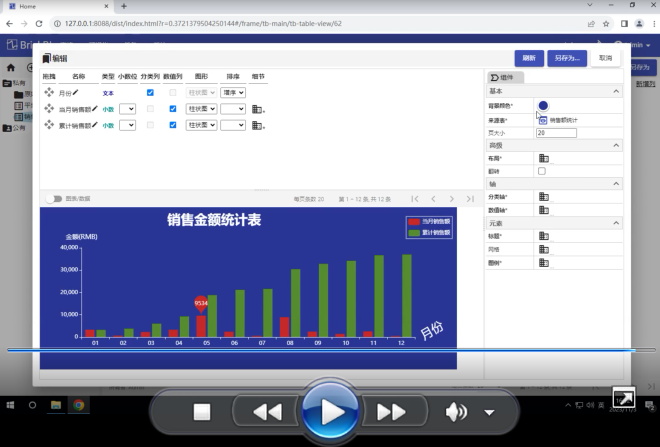
Bar&Line Chart
|
|
| Difficulty: ★ | Duration: 02:44 |
|
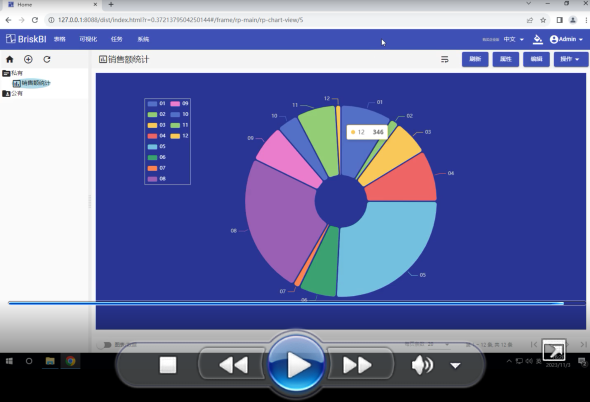
Pie Chart
|
|
| Difficulty: ★ | Duration: 03:04 |
|
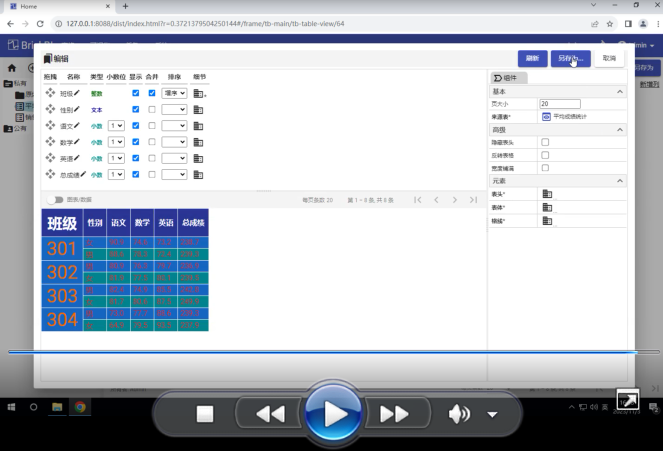
Table
|
|
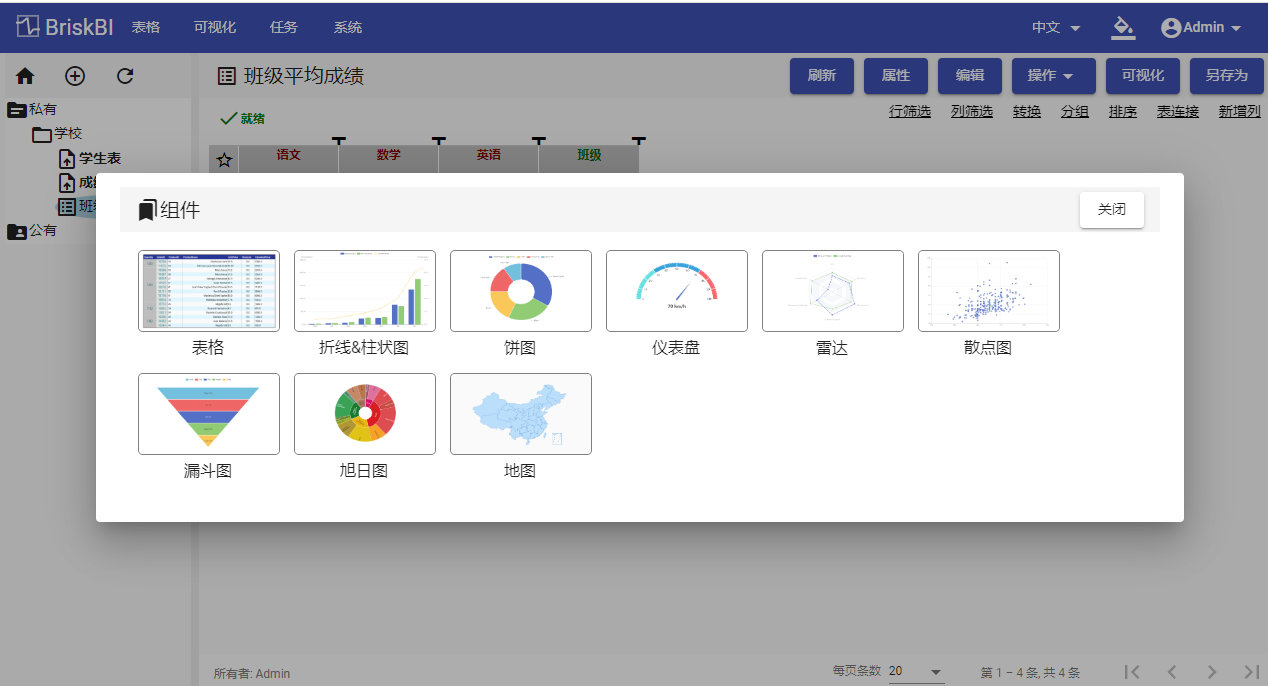
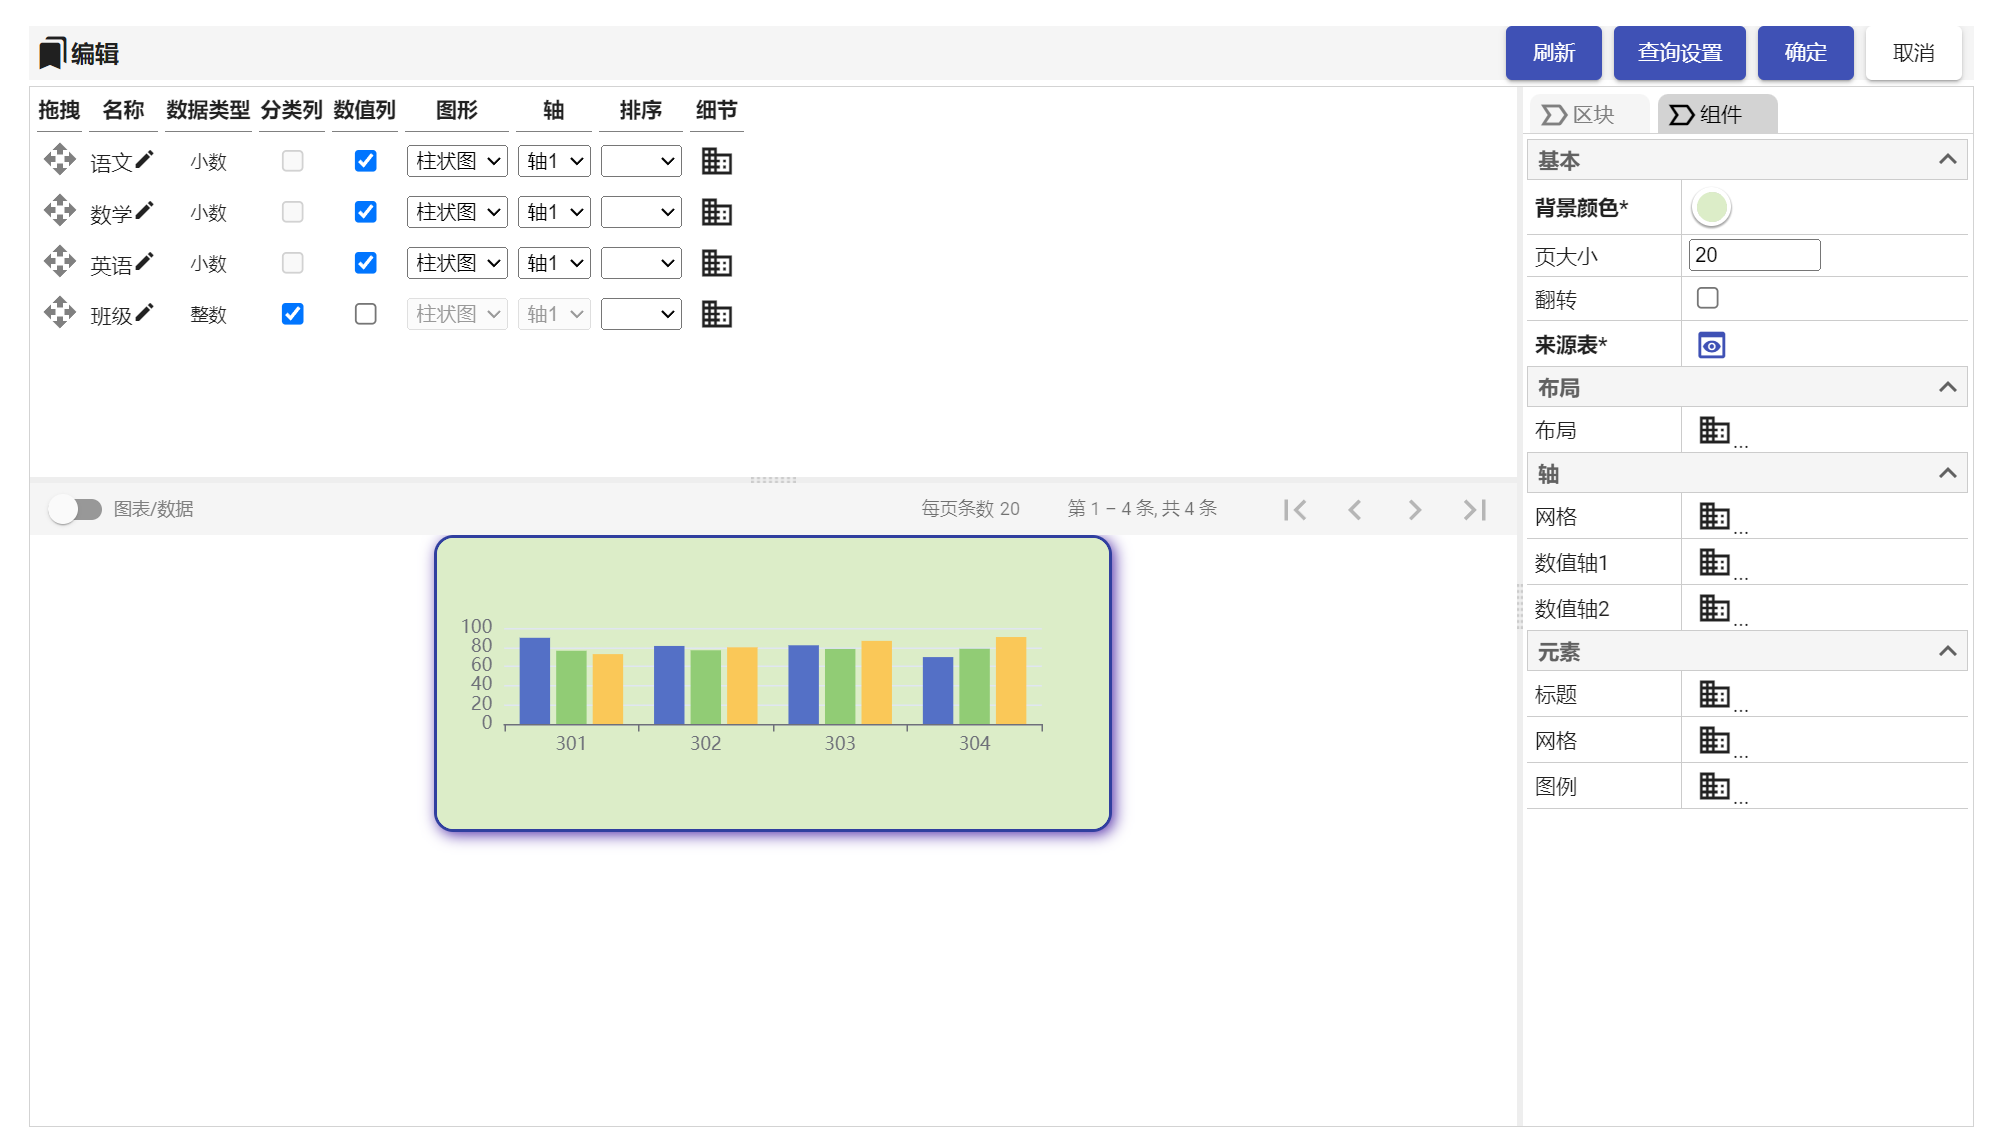
Chart
It can achieve column to row or row to column conversion in a table. Clicking on the "Visualization" button in the upper right corner of the table can generate various forms of charts for table data
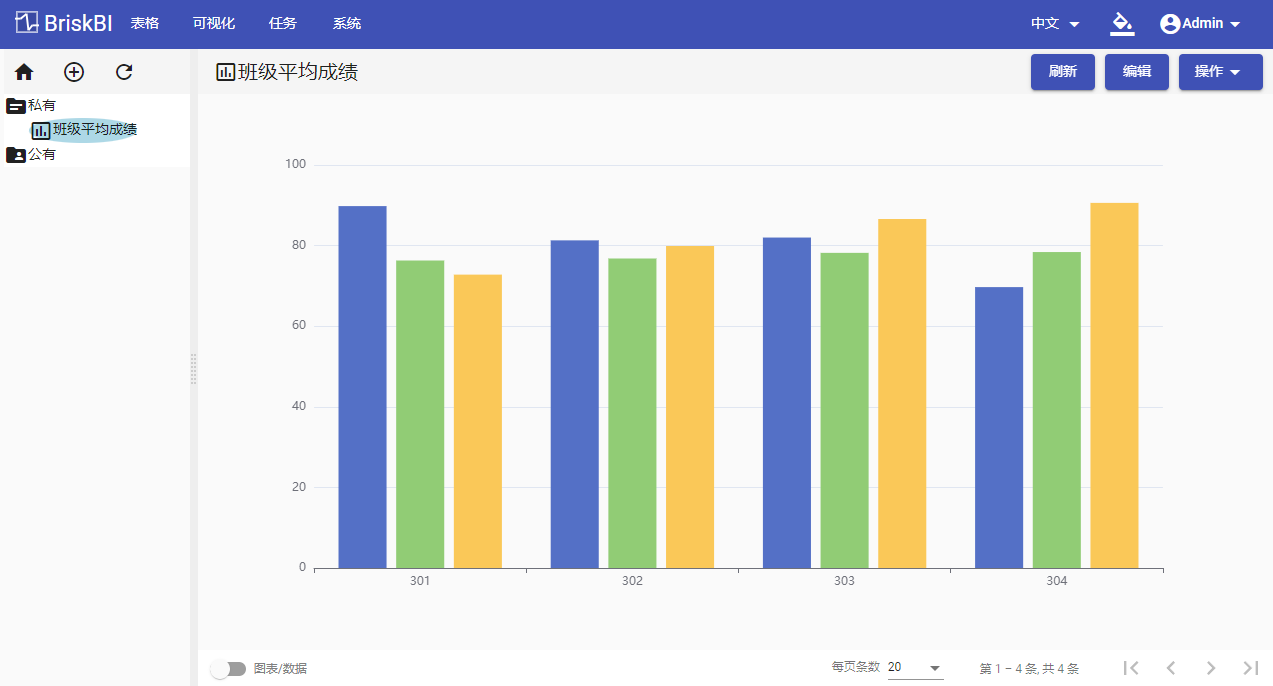
More detailed definitions can be provided for the data and styles displayed in the chart
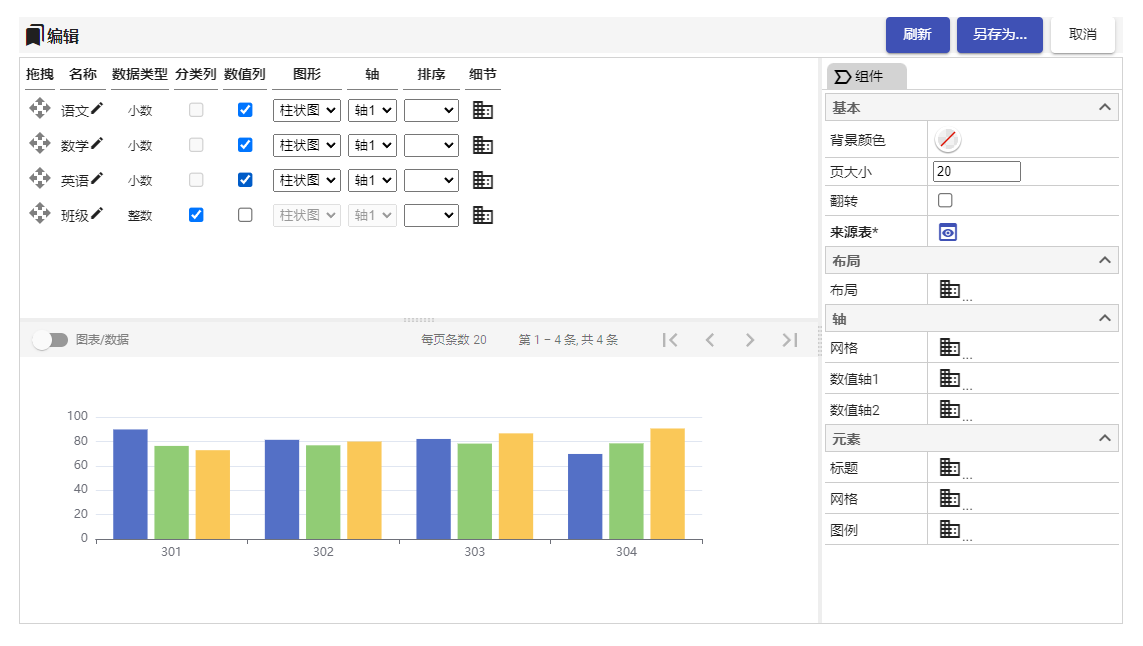
The display effect is as follows
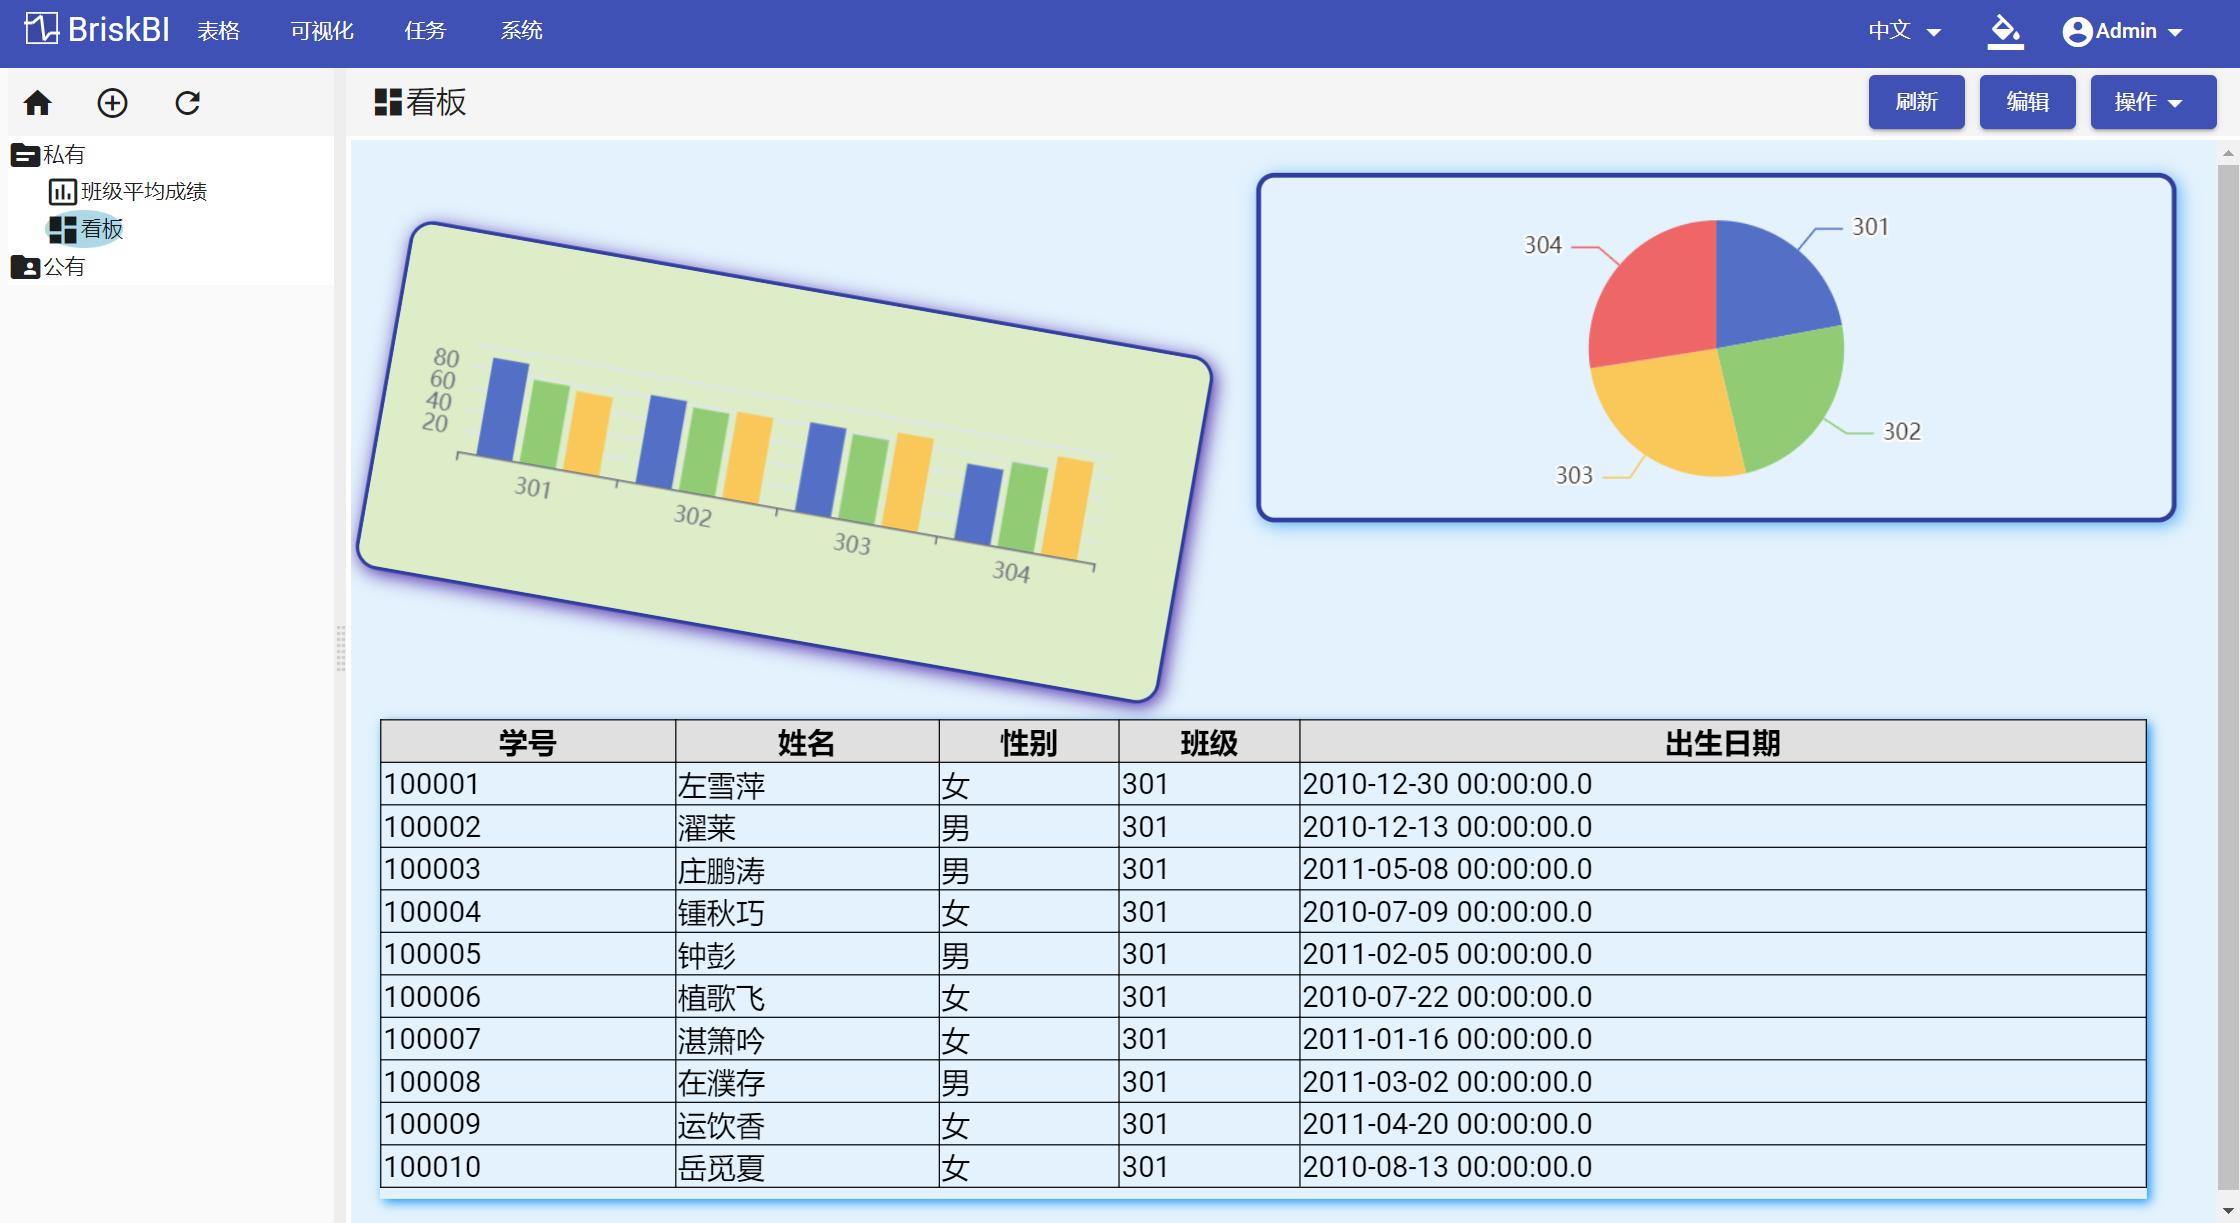
Dashboard
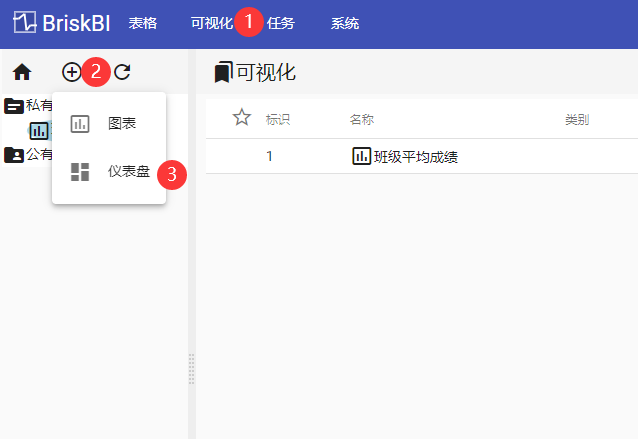
Click to create the dashboard in the order of red serial number
Generate a dashboard like editing a PPT, which can be dragged and resized with elements
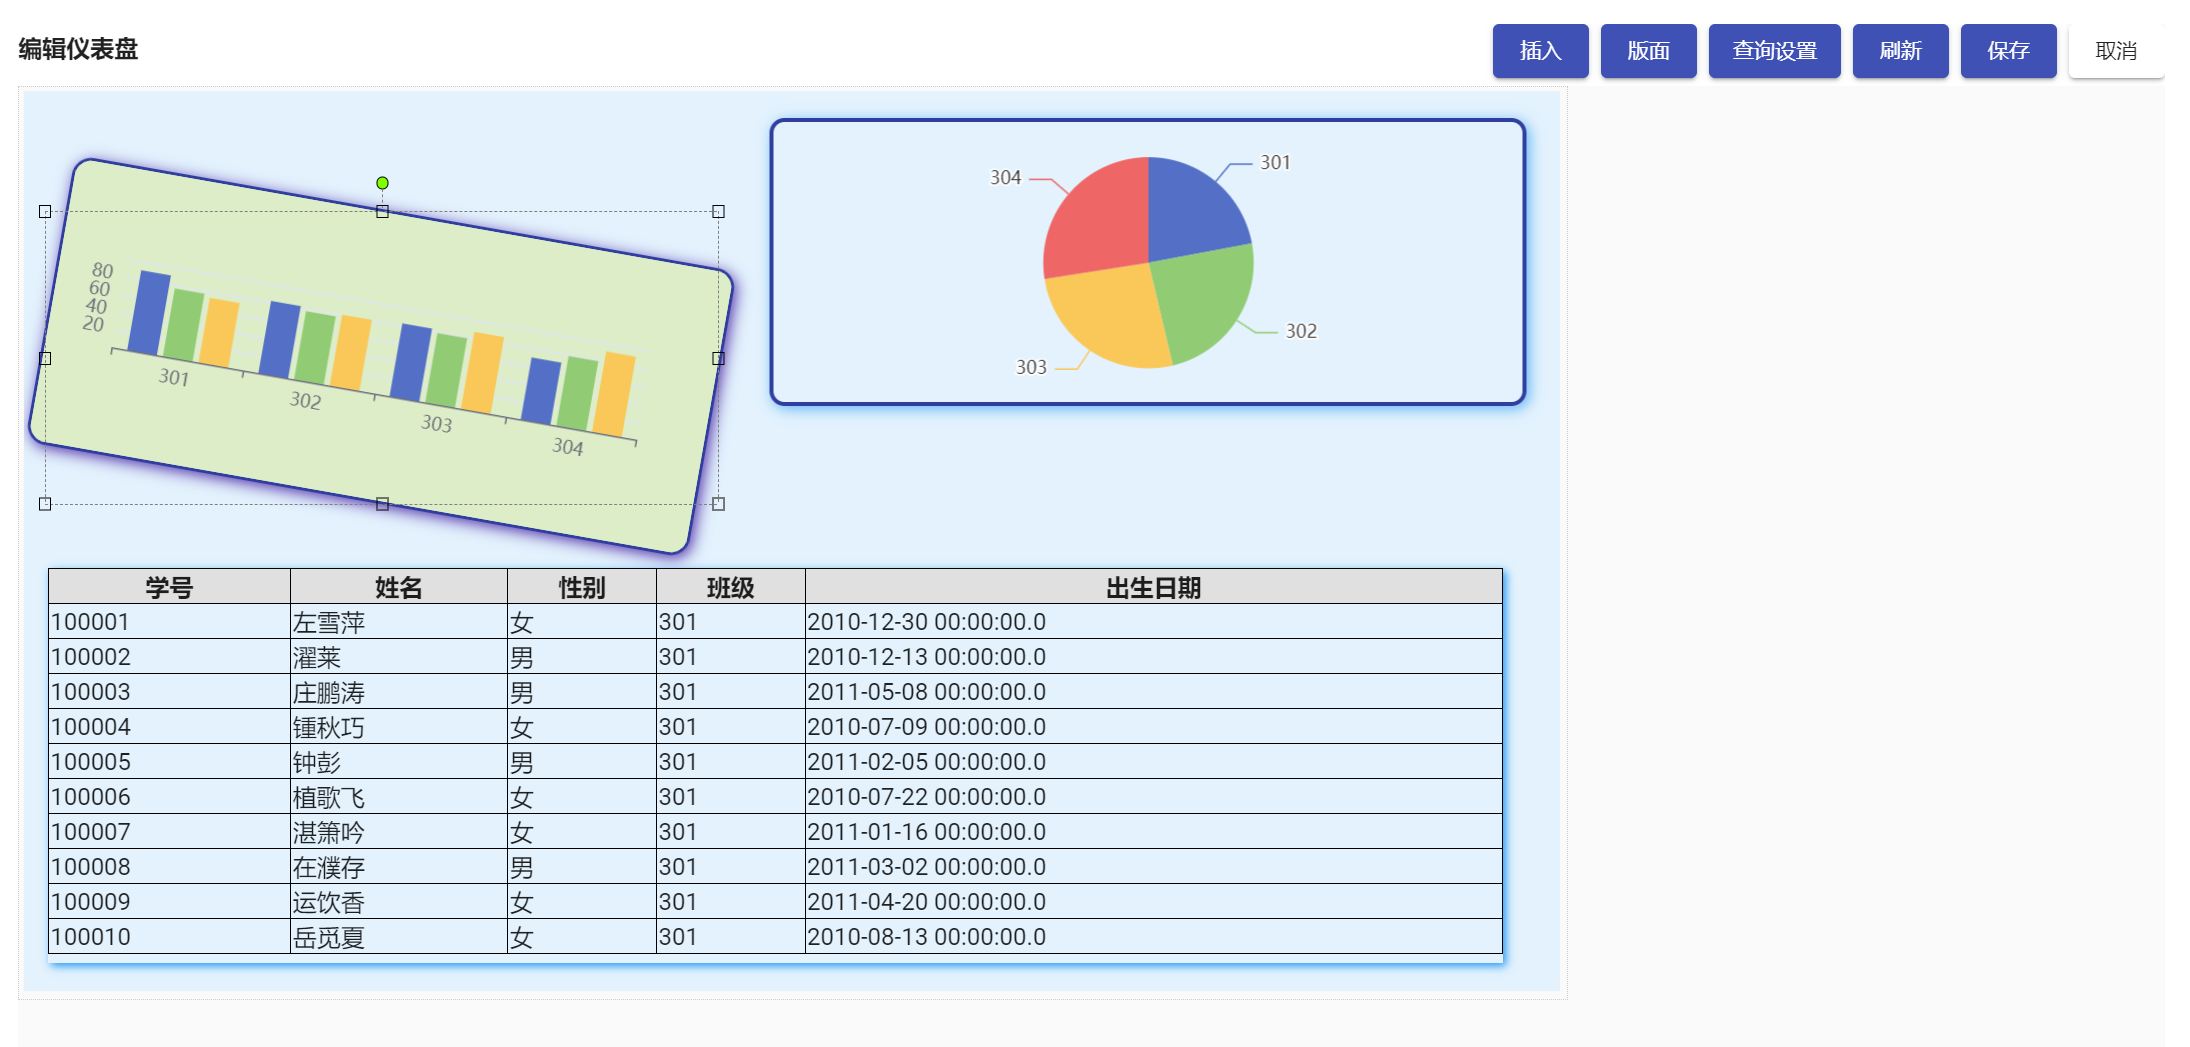
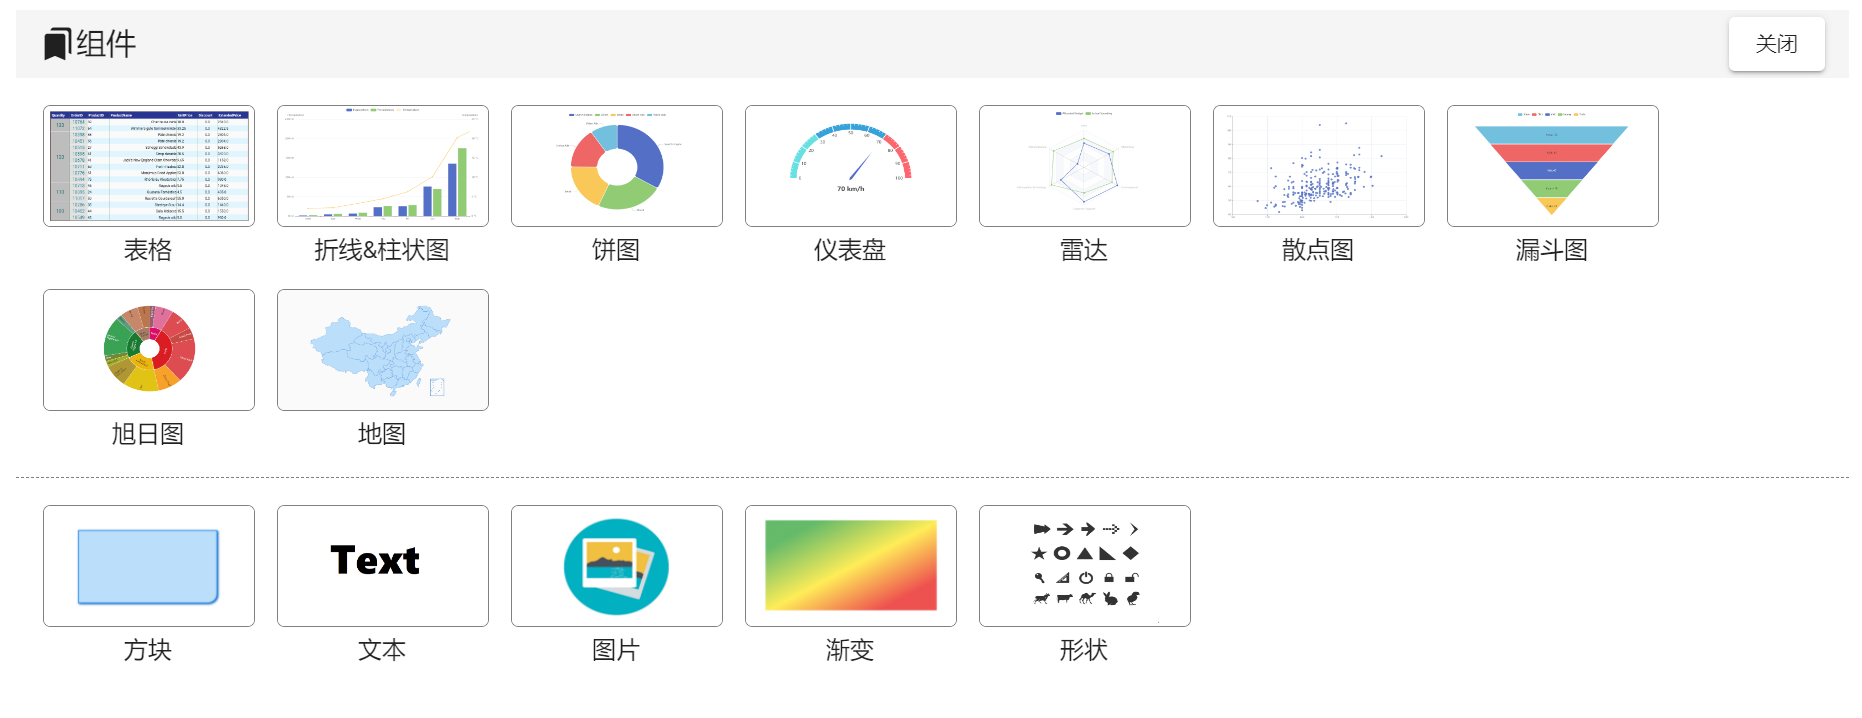
Insert Graphic Component
Can set the attributes and styles of elements
The display effect is as follows